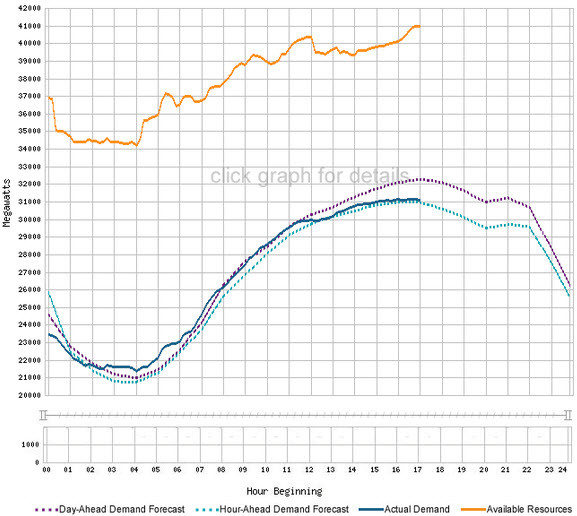
The energy demand on the gird varies by the time of day, the day of the week, the temperature, the latitude of the location, and the seasons (and many other factors). As instant energy generation must follow instant demand, the shape of the daily energy demand is fairly critical. Thankfully, its shape and amplitude are reasonably predictable.
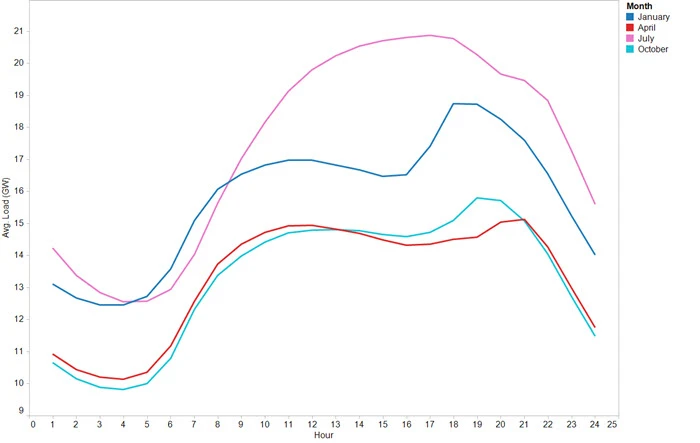
This display of the daily demand for the New England Independent System Operator (which operates the grid in real-time for that region) captures some reasonably typical properties:
- the average load is n general lower in fall and spring, and higher in summer and winter. In many developed countries (but not all), it will be highest in summer, due to the high energy cost of air conditioning.
- in summer, for many most developed countries, there is a single maximum for the daily demand in the mid afternoon. This peak is often the overall peak for the whole year.
- in other seasons, there is often a double peak, in the morning and in the evening, as people have come back from work and start appliances, TVs, hot water heaters etc. The evening peak is in general the daily peak for that season. In some cases, there is no morning peak, as demand remains stable during the work day, or keeps on increasing slowly until the evening peak.
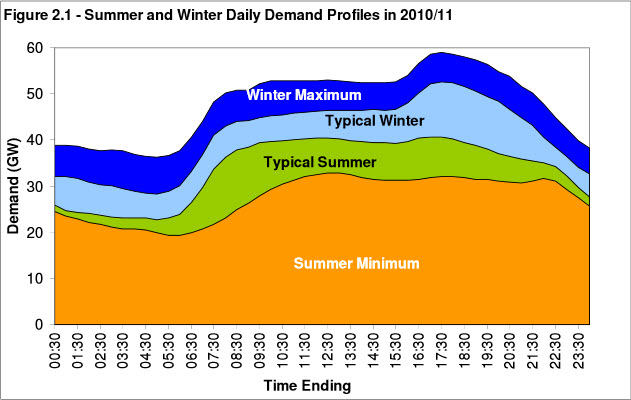
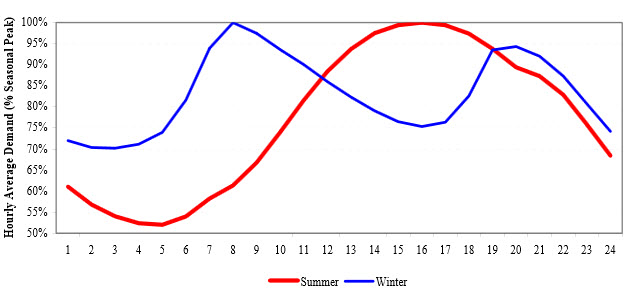
The above figure displays the daily demand for two seasons in the UK, a country with cooler summers than New England. For the UK, we recognize a similar shape for winter, with a high evening peak. Summer has a fairly even work-day consumption, with no significant use of air conditioning, due to the climate. For the same reason, winter calls for more energy sue (heating) than summer.
Again, we recognize the patterns: single afternoon peak for summer, double peak for winter (in this case where the morning peak is higher). Unexpectedly (at least for me), the peak high in winter has been higher than the peak high summer over the past few years (48,872 MW vs. 48,385 MW for 2010 – source Florida Public Utility Commission).
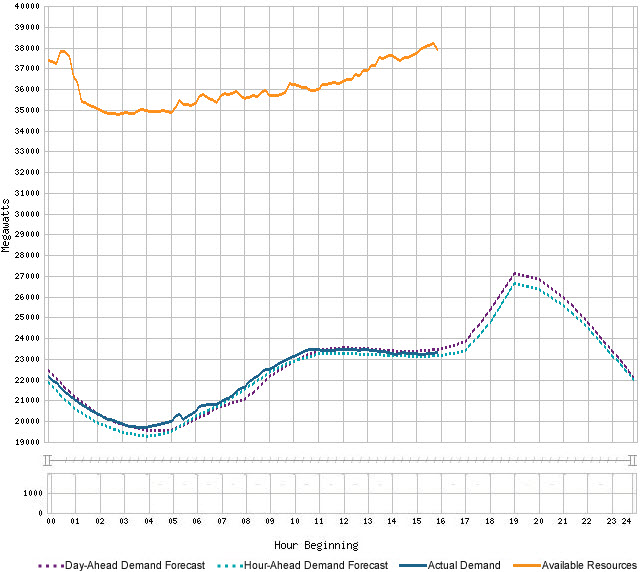
As a last example, following are the daily demand curves for a single winter and summer day for California:
We recognize the characteristic evening peak for this winter day.
… and we recognize the characteristic mid-afternoon peak for this California summer day.
It is interesting to look at what actually constitutes the actual demand for summer and winter days. Following are detailed analyses of winter and summer demand curves for New South Wales in Australia.

Daily Demand, winter, by application, New South Wales (source: Australia Dept of Industry/ Energy Efficiency)
We recognize the characteristics double winter peak, particularly accented in this example. Interestingly, night usage is higher than day use, primarily due to off-peak hot water usage.
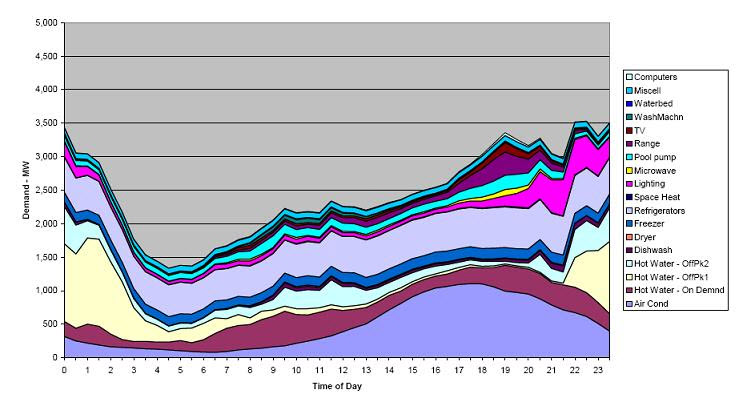
Daily demand, summer, by application, for New South Wales (source: Australia dept of Industry/ Energy Efficiency)
The characteristic single summer peak occurs comparatively very late, and is also topped by night usage, as in the winter demand curve., despite the heavy air conditioning use in mid- and late-afternoon. In both cases, outside of AC, the largest uses of energy are hot water and refrigeration.
The shape of the daily demand curve is particularly important because, as it must be exactly matched instant by instant by the generation on the grid, its requirements are absolute and point at a specific structure for solutions to the generation problem.

